Installing Oracle VM 2.1.5

Here are my experience for installing Oracle VM 2.1.5 on my PC. Oracle VM has 2 components:

  1. Oracle VM server
  2. Oracle VM manager
To install Oracle VM server, follow the following steps:
  1. Download the compressed binary CD image (you must register for free download). Download Oracle VM server from Oracle eDelivery. You do not need to download Oracle VM server source disc to install Oracle VM server, this CD only contain the source code.
  2. Uncompress the CD image
  3. Write the CD image to CD. Use your favorite cd burning software to write this image directly to CD. Do not write the image file to the CD. To test if you have burned the image correctly, insert a burned cd and ensure that multiple files and directories are visible.
  4. Insert the cd, and boot. Lastly, insert the disk into your system, boot from CD, and follow the on-screen instructions to deploy Oracle VM server!
To install Oracle VM manager, follow the following steps:
  1. Download the compressed binary CD image. Download Oracle VM manager from Oracle eDelivery.
  2. Uncompress the CD image.
  3. Write the CD image to CD. Use your favorite cd burning software to write this image directly to CD. Do not write the image file to the CD. To test if you have burned the image correctly, insert a burned cd and ensure that multiple files and directories are visible.
  4. Installation. If you burned the Oracle VM Manager ISO image onto CD, insert the CD into your cd-rom and mount it

    # mount /dev/cdrom /mnt

    if using the Oracle VM Manager ISO image to install, mount iso image

    # mount -o loop, ro OracleVM-manager.iso /mnt

    Start the installation

    # cd /mnt
    # sh ./runInstaller.sh

    and follow the instructions on the screen. For testing and getting familiar with the product, we suggest you accept the defaults values and change them afterwards.

That's it....

Oracle Database 10.2 Installation on Oracle Enterprise Linux 5

Here are my experience for installing Oracle Database 10.2 on Oracle Enterprise Linux:

Extract the installer:
tar -zxvf database.tgz

Make sure your domain are set correctly in host file, /etc/hosts.
For example:
127.0.0.1 localhost.localdomain localhost
192.168.41.82 dbcamps.balicamp.com dbcamps

Edit file sysctl.conf on /etc, insert these line:
kernel.shmmni = 4096
kernel.sem = 250 32000 100 128
net.ipv4.ip_local_port_range = 1024 6500
net.core.rmem_default = 262144
net.core.rmem_max = 262144
net.core.wmem_default = 262144
net.core.wmem_max = 262144

Run this file to activate the changes on kernel:
/sbin/sysctl -p

Edit /etc/security/limit.conf to insert these line:
* soft nproc 2047
* hard nproc 16384
* soft nofile 1024
* hard nofile 65536

Then edit /etc/pam.d/login to insert these line:
session required /lib/security/pam_limits.so

Install these packages in order:
kernel-headers-2.6.18-92.el5.i386.rpm
glibc-headers-2.5-24.i386.rpm
glibc-devel-2.5-24.i386.rpm
libgomp-4.1.2-42.el5.i386.rpm
gcc-4.1.2-42.el5.i386.rpm
compat-libf2c-34-3.4.6-4.i386.rpm
compat-gcc-34-3.4.6-4.i386.rpm
compat-gcc-34-c++-3.4.6-4.i386.rpm
compat-db-4.2.52-5.1.i386.rpm
libXp-1.0.0-8.1.el5.i386.rpm
openmotif-2.3.0-0.5.el5.i386.rpm
Note:You must install those package sequentialy...

Prepare the user and installation folder:
groupadd oinstall
groupadd dba
groupadd oper

useradd -g oinstall -G dba oracle
password

This is just for example, you can make your own directory in your root directory:
mkdir -p /u10/app/oracle/product/10.2.0/db_1
chown -R oracle.oinstall /u10

Then edit /etc/redhat-release, change to this (backup first - remember to restore it later):
redhat-4

Edit this file /home/oracle/.bash_profile, then insert these folowing lines:
#Oracle Settings
TMP=/tmp; export TMP
TMPDIR=$TMP; export TMPDIR

ORACLE_BASE=/u10/app/oracle/; export ORACLE_BASE
ORACLE_HOME=$ORACLE_BASE/product/10.2.0/db_1; export ORACLE_HOME
ORACLE_SID=ORABALI; export ORACLE_SID
ORACLE_TERM=xterm; export ORACLE_TERM
PATH=/usr/sbin:$PATH; export PATH
PATH=$ORACLE_HOME/bin:$PATH;export PATH

LD_LIBRARY_PATH=$ORACLE_HOME/lib:/lib:/usr/lib; export LD_LIBRARY_PATH
CLASSPATH=$ORACLE_HOME/JRE:$ORACLE_HOME/jlib:$ORACLE_HOME/rdbms/jlib;
export CLASSPATH

if [$USER = "oracle"]; then
if [$SHELL = "/bin/ksh"]; then
ulimit -p 16384
ulimit -n 65536
else
ulimit -u 16384 -n 65536
fi
fi

And run those script ass root:
xhost+

Login to oracle account and run these lines:
DISPLAY=:0.0;
export DISPLAY

Entry to the directory that had been extracted, then type:
./runInstaller

After you finished the installation, start the service on your console by typing:
emctl start dbconsole
but before that, you must login with user "oracle".

Then use your browser and type:

http://localhost:1158


That's it.....


Close port 445 to Stop Worm Activities

Even after you disable local file and print sharing, Windows XP still leaves port 445 open and listening for incoming connections. If you are using Internet, this can pose a security risk. To close this port you need to make a change. Here are the some isntruction to close port 445 in Windows XP:

  1. Click "Start"
  2. Click "Run"
  3. type "regedit"
  4. Navigate to HKLM\System\CurrentControlSet\Services\NetBT\Parameters
  5. Find the value "TransportBindName" and right click it to open a menu of options.
  6. Click "Modify"
  7. Where it says "Value data:" delete whatever is in the box to clear the box.
  8. Click "OK"
  9. Close, and Restart your PC.

Installing Oracle Enterprise Linux 5 on VMware Server 2

Here are my experiment with installing Oracle Linux Server (Enterprise Edition) on VMware server 2 (free edition).

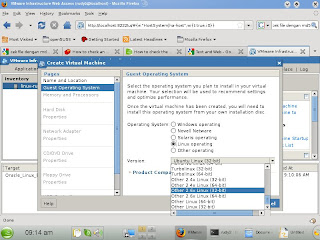
1. Choose "Create Virtual Machine" on Summary tag.
2. Enter Name of Virtual Machine you want to create, if you have more than one datastore, choose one. click Next.


3. On the radio button choose "Linux Operating" with version "Other 2.6.x Linux (32-bit)"


4. Set virtual Memory and Processors, this setting is depending on the configuration of your PC. if it is finished, click Next.


5. Specify the hard disk space do you want to create.


6. Add the Network Adapter.


7. Use the network bridge.


8. On CD/DVD Drive, specify the source file. If you have the ISO file, choose "Use an ISO", if the source from physical CD/DVD Drive, choose "use a Physical Drive".


9. If you need floopy drive, you can add it. But i dont choose to install it.


10. But in this step i choose to add a USB device. Click next.


11. Finish


12. Turn on the machine.

13. Click at the "Console" tag, then click console to open the console in a new window.

Now you have the host for install the Oracle Linux Enterprise. Then you just follow the installation instruction.

Installing VMware Server 2 in openSUSE 11.0

These are short tutorial for installing VMware Server 2 in openSUSE 11.0:

  1. First, check the availability of the prerequisites:
    rpm -qa | egrep "kernel-source|gcc-|make"
    Make sure kernel-source, make, gcc, gcc-c++ already installed, if it's not use YaST to install it.
  2. Run this command as root:
    # cd /usr/src/linux
    # make mrproper; make cloneconfig; make modules_prepare
  3. Download the VMWare .rpm installer and installed using YaST (just double-click the file). Or in the terminal type, #rpm -ivh .
  4. Run configuration script as root:
    # /usr/bin/vmware-config.pL
  • accept the licence agreement. (Press enter and the space bar to scroll through and enter q at the end to quit)
  • configuration starts and in most cases you can accept the defaults.
  • choose "Bridged" for the networking option.
  • choose your username when asked: "Please specify the user whom you wish to be the VMware Server administrator".
  • if asked "Do you want this program to try to build the vmmon module for your system?", then answer "yes".
  • if told that there's a difference between various "gcc" modules and then asked if you want to proceed anyway, then answer "yes".
  • finally, enter the software key. (A8H80-PAF8N-0CM9M-4RJ09)
5. Open YaST- System - System Services (Runlevel). Enable vmware in the the "Service" list, leaving the other vmware services alone. In "Expert" mode, vmware is set to runlevels 2, 3 and 5 and the other vmware-related services aren't set for any runlevels. Stop the 4 vmware services (that you see in Yast's System Services [Runlevel]) from running concurrently at boot time. They are supposed to run consecutively. Edit the file /etc/sysconfig/boot and find the line RUN_PARALLEL="yes". Change yes to no. That will cause the startup scripts to run consecutively.

6. Start it manually :
# sudo /etc/init.d/vmware start

7. Open the browser:
http://localhost:<8222>
8222 is default port for VMware server.


That's it..

NORMALIZATION (SECOND)

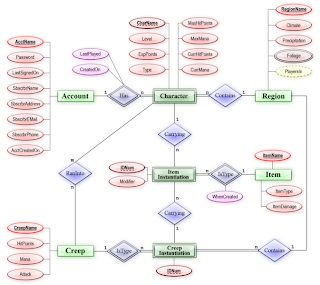
In this post we will discuss about how to do the normalization. The picture below is an example ER diagram that normalization will be done.


After we learned ER diagram above carefully, then the first thing we will do is called mapping in the form of a table. Note the relationship between the entities and attributes that are in it, because the relationship between entities is important in making the final table later. Then after mapping the results are as follows.


For the normalization phase, the need to do is remove the recurrence occurred on the table. Once we do this before the table is already in the form of 1NF.


A relationship is said to meet the second normal form of relations, when the relation is meet the first normal form, and the attributes that are not key is dependent on the key itself. Seen there on the table of pegawai increased to 2 tables in second normal form.


A relationship is said to satisfy the third normal form relations, when the relation meet the second normal form and he attributes that are not key is not transitive dependent on the key itself. Same as in the second normal form, the changes only on the table pegawai only.


This table is only up to the third normal form only, because it is not possible any longer to reach the next normal form.

NORMALIZATION

In his seminal paper on the relational data model, E.F. Codd formulated a number of design principles for a relational database (Codd, 1970). These principles were originally formalized in terms of three normal forms: first normal form, second normal form and third normal form. The process of transforming a database design through these three normal forms is known as normalization. By the mid-1970s third normal form was shown to have certain inadequacies and a stronger normal form, known as Boyce–Codd normal form (BCNF), was introduced (Codd, 1974). Subsequently Fagin introduced fourth normal form and indeed fifth normal form (Fagin, 1977; 1979).
Normalization process is the establishment of the database structure so that most of the ambiguity can be removed. The normalization of starting the light phase (1NF) to most stringent (5NF). Usually only up to the level of 3NF or BCNF because already sufficient to generate the table-a table of good quality.


1. Why Normalize?
  • Optimization table structures
  • Increase the speed
  • Eliminate income the same data
  • More efficient use of storage media
  • Reduce redundancy
  • Avoiding anomalies (insertion anomalies, deletion anomalies, update anomalies).
  • Improved data integrity

2. Stages of Normalization

Normalization is carried out in the following steps:
  • Collect the data-set – the set of data-items
  • Transform the unnormalized data-set into tables in first normal form
  • Transform first normal form tables to second normal form
  • Transform second normal form tables to third normal form

Occasionally, the data may still be subject to anomalies in third normal form.
In this case, we may have to perform further steps:
  • Transform third normal form to Boyce–Codd normal form
  • Transform third normal form to fourth normal form
  • Transform fourth normal form to fifth normal form

The process of transforming an unnormalised data-set into a fully normalised (third normal form) database is frequently referred to as a process of non-loss decomposition. This is because we continually fragment our data structure into more and more tables without losing the fundamental relationships between data-items.

2.1 Determinancy/Dependency


Normalisation is the process of identifying the logical associations between data-items and designing a database which will represent such associations but without suffering the file maintenance anomalies.
The logical associations between data-items that point the database designer in the direction of a good database design are referred to as determinant or dependent relationships. Two data-items, A and B, are said to be in a determinant or dependent relationship if certain values of data-item B always appear with certain values of data-item A.
Determinancy/dependency also implies some direction in the association. If data-item A is the determinant data-item and B the dependent data-item then the direction of the association is from A to B and not vice versa. There are two major types of determinancy or its opposite dependency: functional (single-valued) determinancy, and non-functional (multi-valued) determinancy. We introduce here the concept of functional determinancy. Non-functional determinancy is discussed below.
Data-item B is said to be functionally dependent on data-item A if for every value of A there is one, unambiguous value for B. In such a relationship data-item A is referred to as the determinant data-item, while data-item B is referred to as the dependent data-item. Functional determinancy is so-called because it is modelled on the idea of a mathematical function. A function is a directed one-to-one mapping between the elements of one set and the elements of another set.


2.2 Unnormalized Data-Set to First Normal Form

The data-set represented in tabular form in section 18.2 is said to be an unnormalized data-set. This can be seen, for instance, if we choose the data-item moduleName as the key of this data-set and underline it to indicate this. Realistically, if we remove redundant information, we should represent the information as follows:


A given cell of the table for the attributes studentNo, studentName, assGrade and assType contains multiple values. Examining the table above we see that studentNo, studentName, assGrade and assType all repeat with respect to moduleName.

A relation is in first normal form if and only if every non-key attribute is functionally dependent upon the primary key

The attributes studentNo, studentName, assGrade and assType are clearly not functionally dependent on our chosen primary key moduleName. The attributes staffNo and staffName clearly are. This means that we form two tables: one for the functionally dependent attributes, and one for the non-dependent attributes. We declare a compound of moduleName, studentNo and assType to be the primary key of this second table.


2.3 First Normal Form to Second Normal Form

To move from first normal form to second normal form we remove part-key dependencies. This involves examining those tables that have a compound key and for each non-key data-item in the table asking the question: can the data-item be uniquely identified by part of the compound key?

A relation is in second normal form if and only if it is in first normal form and every non-key attribute is fully functionally dependent on the primary key

Take, for instance, the table named Assessments. Here we have a three-part compound key moduleName, studentNo and assType. We ask the question above for each of these data-items in relation to the non-key data-items studentName and assGrade. Clearly we need all the items of the key to tell us what the assessment grade is. ModuleName however has no influence on the
studentName. StudentNo alone determines studentName. Hence, we break out the determinant and dependent data-items into their own table. This leads to a decomposition of the tables as follows:


2.4 Second Normal Form to Third Normal Form

To move from second normal form to third normal form we remove inter-data dependencies. To do this we examine every table and ask of each pair of non-key data-items: is the value of data-item A dependent on the value of data-item B, or vice versa? If the answer is yes we split off the relevant data-items into a separate table.

A relation is in third normal form if and only if it is in second normal form and every non-key attribute is non-transitively dependent on the primary key

The only place where this is relevant in our present example is in the table called Modules. Here, staffNo determines staffName. StaffName is hence transitively dependent on moduleName. StaffNo is therefore asking to be a primary key. Hence, we create a separate table to be called Lecturers with staffNo as the primary key. This is illustrated below:


2.5 BCNF

BCNF is a stronger normal form than third normal form, designed to cover anomalies that arise when there is more than one candidate key in some set of data requirements.

Example:
Suppose we have introduced a scheme of majors and minors into our degree schemes at a university. The business rules relevant to that part of this domain covering majors are listed below:
  • Each student may major in several areas
  • A student has one tutor for each area
  • Each area has several tutors but a tutor advises in only one area
  • Each tutor advises several students in an area

A diagram incorporating all these business rules is given in figure below.


On the basis of these business rules, a schema is produced in third normal form, represented in the bracketing notation below:

Majors(studentNo, area, staffNo)

A set of sample data is provided in the table below.


This schema is in third normal form because there are no partial dependencies and no inter-data dependencies. However, anomalies will still arise when we come to update this relation. For instance:
  • Suppose student 123456 changes one of his or her majors from computer science to information systems. Doing this means that we lose information about staffNo 234 tutoring on computer science. This is an update anomaly.
  • Suppose we wish to insert a new row to establish the fact that staffNo 789 tutors on computer science. We cannot do this until at least one student takes this area as his or her major. This is an insertion anomaly.
  • Suppose student 345678 withdraws from the university. In removing the relevant row we lose information about staffNo 567 being a tutor in the area of information systems. This is a deletion anomaly.
These anomalies occur because there are two overlapping candidate keys in this problem. R.F. Boyce and E.F. Codd identified this problem and proposed a solution in terms of a stronger normal form known as BCNF. A relation is in BCNF if every determinant is a candidate key. The schema above can be converted into BCNF in one of two ways. The two schemas are presented in bracketing notation below:

Schema 1:
StudentTutors(studentNo, staffNo)
TutorAreas(staffNo, area)
Schema 2:
StudentTutors(studentNo, area)
TutorAreas(staffNo, area)

2.6 Fourth and Fifth Normal Form

Relations in the fourth normal form (NF 4) if the relation in BCNF and does not contain a lot of dependence values. To remove the dependency of many values from a relation, we divide the relationship into two new relations. Each relation contains two attributes that have a lot of relationship value.
Relations in fifth normal form (5NF) deal with a property called 'join' without any loss of information (lossless join). Fifth normal form (also called the 5 NF PJNF (projection join normal form). The case is very rare and appear difficult to detect in practice.


DATABASE AND E-R DIAGRAM

1. Database Definition


The database (English language: a database), or often also spelled database, is the collection of information stored in the computer so that it can be systematically examined using a computer program to obtain information from the data base. Software used to manage and call the query (query) of data base is called the database management system (DBMS).
Basic concept of the database is a collection of records, or snippets of knowledge. A database has a structured explanation of the types of facts stored in it: this description is called the scheme. Scheme describes the objects that represented a data base, and the relationship between these objects. There are many ways to organize the scheme, or structure model of the database: this is known as the database model or data model. Model that is now commonly used relational model, according to Layman: the term represents all the information in the form of table-related tables where each table consists of rows and columns (using the definition of the actual mathematical terminology). In this model, the relationship between the table represented by using the same value across the table. The other models, such as the hierarkis network model and use a more explicit way to represent relationships between tables.


2. Database Management System

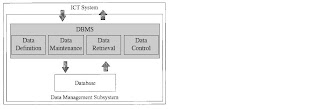
A Database Management System (DBMS) is an organised set of facilities for accessing and maintaining one or more databases. A DBMS is a shell which surrounds a database or series of databases and through which all interactions take place with the database. The interactions catered for by most existing DBMS fall into four main groups:
a. Data definition – defining new data structures for a database, removing data structures from the database, modifying the structure of existing data.


b. Data maintenance – inserting new data into existing data structures, updating data in existing data structures, deleting data from existing data structures.
c. Data retrieval – querying existing data by end-users and extracting data for use by application programs.
d. Data control – creating and monitoring users of the database, restricting access to data in the database and monitoring the performance of databases.


3. Data Definition

A database is effectively a set of data structures for organising and storing data. In any data model, and consequently in any DBMS, we must have a set of principles for exploiting such data structures for information systems applications within organisations. Data definition is the process of exploiting the inherent data structures of a data model for a particular organisational application.

3.1 Relations

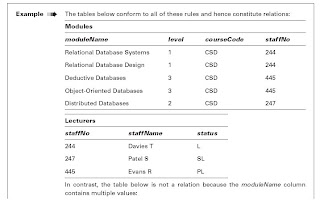
There is only one data structure in the relational data model – the relation. Because the idea of a relation is modelled on a mathematical construct, a relation is a table which obeys a certain restricted set of rules:
  • Every relation in a database must have a distinct name.
  • Every column in a relation must have a distinct name within the relation.
  • All entries in a column must be of the same kind. They are said to be defined on the same domain.
  • The ordering of columns in a relation is not significant.
  • Each row in a relation must be distinct. In other words, duplicate rows are not allowed in a relation.
  • The ordering of rows is not significant.
  • Each cell or column/row intersection in a relation should contain only a socalled atomic value. In other words, multiple-values are not allowed in the cells of a relation


3.2 Primary Key

Each relation must have a primary key. This is to enforce the property that duplicate rows are forbidden in a relation. A primary key is one or more columns of a table whose values are used to uniquely identify each of the rows in a table. In any relation there may be a number of candidate keys; that is, a column or group of columns which can act in the capacity of a unique identifier. The primary key is chosen from one of the candidate keys.
Example:
Consider the relation named Lecturers above. The attributes staffNo, staffName and status are currently candidate keys since the values in these columns are currently unique. We know in practice, of course, that as the size of the lecturers table grows, we may store information about more than one lecturer named Evans R, and more than one lecturer is likely to be a senior lecturer – an SL. This leaves staffNo – a unique code for each lecturer of a university – as the only practicable primary key.

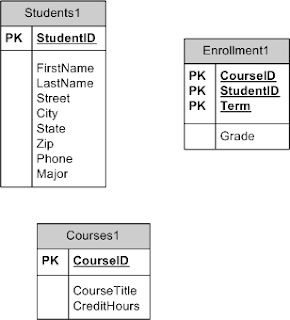
Any candidate key, and consequently any primary key, must have two properties. It must be unique, and it must not be null – a special character being used to indicate a missing or incomplete datum. First, by definition any candidate key must be a unique identifier. Hence, there can be no duplicate values in a candidate or primary key column. Second, we must have a primary key value for each row in a table. In other words, we cannot have a null (non-existent)
value within a primary key column or columns. Picture below is example of primary key.


3.3 Domains

The primary unit of data in the relational data model is the data-item. Such data-items are said to be non-decomposable or atomic. A set of such data-items of the same type is said to be a domain. Domains are therefore pools of values from which actual values appearing in the columns of a table are drawn.
Example:
Examples of data-items include a staff number such as 244, a lecturer name such as S Patel or a student’s date of birth such as 1/7/1986. Suppose there are four members of staff in our institution with the staff numbers 244, 386, 534 and 222. The domain of staff numbers is the set of all possible staff numbers, in our case {244, 386, 534, 222}.

3.4 Foreign Key

Foreign keys are the means of interconnecting the data stored in a series of disparate tables. A foreign key is a column or group of columns of some table which draws its values from the same domain as the primary key of some related table in the database.
Example:
Consider the relation named Lecturers above. staffNo is a foreign key in the modules table. This column draws its values from the same domain as the staffNo column – the primary key of the lecturers table. This means that when we know the staffNo of some lecturer we can cross-refer to the lecturers table to see, for instance, the status of that lecturer.

3.5 Super Key

Superkey is one or more attributes of a table that can be used to identify the entity / record from the table which are unique (not all attributes can be superkey).

3.6 Candidate Key

Candidate Key is a super key with minimal attributes. Candidate must not contain a key attribute of the table so that the other candidate key is certain superkey but not necessarily vice versa.


4. Entity Relationship Model

Entity-Relationship Model (ERM) is an abstract and conceptual representation of data. Entity-relationship modeling is a database modeling method, used to produce a type of conceptual schema or semantic data model of a system, often a relational database, and its requirements in a top-down fashion.

Diagrams created using this process are called entity-relationship diagrams, or ER diagrams or ERDs for short. The definitive reference for entity relationship modelling is generally given as Peter Chen's 1976 paper[1]. However, variants of the idea existed previously (see for example A.P.G. Brown[2]) and have been devised subsequently.


5. Data Models

5.1 Entities

An entity may be defined as a thing which an organisation recognises as being capable of an independent existence and which can be uniquely identified. An entity is an abstraction from the complexities of some domain. When we speak of an entity we normally speak of some aspect of the real world which can be distinguished from other aspects of the real world. An entity may be a physical object such as a house or a car, an event such as a house sale or a car service, or a concept such as a customer transaction or order. Although the term entity is the one most commonly used, following Chen (1976) we should really distinguish between an entity and an entitytype.
An entity-type is a category. An entity, strictly speaking, is an instance of a given entity-type. There are usually many instances of an entity-type. It must be remembered however that whenever we refer to an entity we normally mean an entity-type. Entities are by their very nature interesting things because entities are normally used to define logical data groupings. In conventional information systems jargon the term logical data grouping normally means a file. One rule of thumb to apply in identifying suitable entities for a given application is therefore the following:

If you need to store data about many properties of some thing, then that thing is likely to be an entity.

5.2 Relationship
A relationship is some association between entities. In this section we shall concentrate on binary relationships. That is, associations between two entities. In section 16.4 we shall introduce other N-ary relationships. That is, relationships between one, three, four or N entities. In the E–R approach, more than one relationship can exist between any two entities.

5.3 Attributes

As a real-world aspect, an entity is characterised by a number of properties or attributes. Values assigned to attributes are used to distinguish one entity from another. We also choose one or more attributes to act as identifiers for instances of an entity.

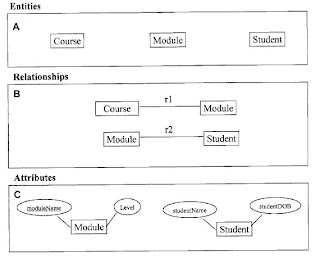
This picture below is the examples of entities, relationship, and attributes.


6. Cardinality

Cardinality (or degree) concerns the number of instances involved in a relationship. A relationship can be said to be either a 1:1 (one-to-one) relationship, a 1:M (one-to-many) relationship, or a M:N (many-to-many) relationship.
Example:
The relationship between a Bankaccount entity and a Customer entity can be said to be one-to-one (1:1) if it can be defined in the following way:

A bank account is held by at most one customer
A customer may hold at most, one bank account


In contrast, the relationship between Bankaccount and Customer is one-to-many (1:M) if it is defined as:

A customer holds many bank accounts
A bank account is held by at most one customer


Finally, we are approaching a realistic representation of the relationship when we describe it as being many-to-many (M:N). That is:

A customer holds many bank accounts
A bank account may be held by many customers


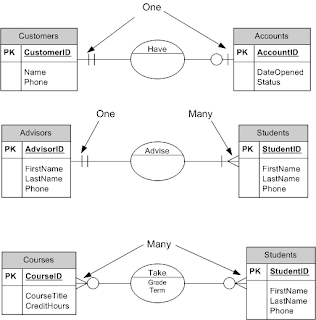
The other example of Cardinality:


7. E-R Notation


DATA FLOW DIAGRAM

The idea of a chart to represent data in a system that is not new. In the year 1967, Martin and Estrin introduce an algorithm program by using the circle and arrow symbols to represent data flow. E. Yourdan and L.L. Constantine also use this notation symbols to describe the flow of data in the design program. GE Whitehouse 1973 also use the notation to make this kind of model system
mathematics. The use of notation in the data flow diagram is very helpful to understand at all levels complexity such as that expressed by Chris Gane and Trish Sarson. The data flow diagram describing the system modules in a smaller part. Easily the less understood areas of the computer to understand the system that will be done.


Context Diagram
Context diagram consists of a process and describe the scope of a system and it is the highest level of the DFD that describes the input to and output from the entire system. The system is limited by boundary (depicted by broken lines) and there is no storage (storage).


Zero Diagram
Zero diagram describes the process of the DFD. It's provides a view of the overall system, showing the main function or process that is, and the showing the flow of data and external entity. At this level, the data storage is possible. The process is no longer detailed on the next level then added the symbol '*' or 'P' at the end of the process. The input and output balance between zero diagram and context diagram should be maintained.


Detailed Diagram
Detailed diagram is a diagram which explain the process in the zero diagram or above. Numbering level in the DFD is as follows:


Symbols That Used to DFD

Some of the symbols used in the DFD are as follows:
1. external entity or boundary
2. data flow
3. process
4. data store


1. External Entity
Each system has certain boundaries that separate a system with the environment outside the system. The system will receive input and produce output to the outside environment. External entity is an entity in environment outside the system that can be a human being, organization, or the other system. Most external entity is one of the following:

  1. An office, department or division in the company but outside the system that is being developed.
  2. Person or a group of people in the organization but outside of that system is being developed.
  3. An organization or a person outside the organization such as customer and supplier.
  4. Other information systems outside the system that is being developed.
  5. Original source of a transaction.
  6. Recipient of a final report produced by the system.

External entity can symbolized with a notation box.


2. Data Flow
Data flow is a place of information flow. Data flow depicted with a straight line connecting the components of the system. Data flow is shown with the direction arrows and the name on the flow of data that flows. The data flow is pour between processes, storage data, and its indicates that the form of data input for the system.
Here are some examples of data flow:
a. Forms or documents used in the company.
b. Printed reports generated by the system.
c. Display or output on a computer screen generated by the system.
d. Input to the computer.
e. Speech communication.
f. Letter or memo.
g. Data is read or recorded to a file.
h. A field note book on the agenda.
i. Transmitting data from one computer to another.
Flow data should be given the name and have a clear meaning. The name of the data flow in addition to the written its arrow. Following example:


Guidelines for naming:
1. The flow of data flow consists of several words associated with the line speed
2. No data flow of the same name and should reflect the contents
3. Flow of data that consists of several elements can be expressed with the group element
4. Avoid using the word 'data' and 'information' to give a name to the flow of data
5. Wherever possible the complete flow of data is written


3. Process
A process is an activity or work done by the person, machine or a computer from the result of data flow into the process for generated data that will flow out of the process. The process is what is done by the system and then can process data flows or data entry into the flow of data out. The transform function of one or more of data input into one or more of the output data in accordance with the desired specifications so each process has one or more inputs and produce one or more output. The process is also called bubble.
A process can be indicated with a circle symbol or rectangle with straight corners blunt.


Each process must be given a full explanation include the following.
  1. Identification process. This included the identification of a number that indicates the number of reference and the process is written at the top of the symbol in the process.
  2. Name of the process. The name indicates that the process is done by the process. Name of the process must be clear and complete.
  3. Processor. The processor may not be listed.

Guidelines naming of the process:
  1. The process consists of a verb and noun, which reflects the function of the process.
  2. Do not use the process as part of the name of a bubble.
  3. There may be some process that has the same name.
  4. The process must be given a number. Order number wherever possible to follow the flow of the process or sequence, but the sequence number does not mean that the absolute is a process in chronological order.


4. Data Store
Data storage is a storage place for data that exists in the system.
Symbolized with a pair of parallel lines or two lines with one side open side. The process can retrieve data from or provide data to the database.
Guidelines for naming:
1. The name should reflect the data storage.
2. When its name more than one word must be marked with the number.

Data store can be as follows:
a. A file or database in the computer system.
b. An archive or records manual.
c. A box of data.
d. A table reference manual.
e. Agenda or a book.


DFD SYMBOL


Type of Data Flow Diagram
There are 2 forms of DFD, the physical data flow diagram and logical data flow diagram. Physical data flow diagram more emphasis on how the process of the system is applied while
logical data flow diagram is to emphasize the process of what is found in the system.
  1. Physical Data Flow Diagram, more appropriately used to describe the existing system. The emphasis on this diagram is how the processes of the system is applied. PDFP must include the following:
    1. Manual processes are also described.
    2. Name of the flow data must indicate the number of such application form and the medium.
    3. Savings data can show savings of non-computer.
    4. The name of saving the data type of application must show, whether manual or computerized.
    5. The process must show the name of the processor, the man, ministry, computer system or computer program to access the process.
  2. Logical Data Flow Diagram, more appropriately used to describe the system that will be proposed. LDFD does not emphasize on how the system implemented, but the emphasis only on the logic of the needs of the system.
For computerized systems, drawing LDFD that shows only the needs of the proposed logic of system, usually the processes described is only the computer proces only.


Data Dictionary


Data dictionary is to help the system to interpret the application in detail and organize all elements of the data used in the system precisely so that the system analyst have a basic understanding of the same input, output, storage and process.
At analysis step, the data dictionary is used as a means of communication between the systems analyst with the user, and at the design stage of the system, the data dictionary is used to design input, reports and databases. Load the data dictionary as follows:
  1. The flow of data: should be noted that readers who need further explanation about a flow of data can find it easily.
  2. Alias: alias or other name of the data can be written when it is existence.
  3. The form of data: used to segment the data dictionary to use when designing the system.
  4. Data flow: indicates from which data flows and where the data goes.
  5. Description: provides an explanation about the meaning of the data flow.


Balancing in DFD

Balancing in DFD means flow of data into and out of a process must be the same as the flow of data into and out of the details of the process on the level/levels below. Besides then the flow of data into and out of the process must match the name of the flow of data into and out of the details of the process. The number and name of an entity outside the process must be equal to the number of names and entities outside of the details of the process.
There are some issues that must be considered in the DFD which have more than one level:
  1. Must be balance between input and output of one level and next level.
  2. Balance between level 0 and level 1 at the input / output of stream data to or from the terminal on level 0, while the balance between level 1 and level 2 is seen on the input / output of stream data to / from the process concerned.
  3. The flow of data, the data storage and the terminals at each level must be the same if its the same object.


Prohibition in DFD
  1. Flow data may not be from outside the entity directly to other outside entities without going through a process.
  2. Flow data may not be from the savings directly to the data to outside entities without going through a process.
  3. Flow data may not be saving the data directly from the other savings data without going through a process.
  4. Flow of data from one process directly to the other without going through the process of saving data should or be avoided as much as possible.

FIRST OBSERVATION, ANALISYS REQUIREMENT

CONCEPT OF INVESTIGATION SYSTEM
There are some point about Investigation System Concept, which the following:

1. Discrepancy between the objective of system and the real condition of system
2. Problem detection report is not real, because:
- the objective is too ideal
- lack of attitude and resources
- system measuring is not accurate
- the objective of system which have to be left behind
- difference between the idle system and the temporary system
3. The Problem solving
- investigation to the system which is running
- getting the ideal system consensus
- choose the best alternative
4. The objective of investigation have to show the problem which in fact is happened


PROBLEMS IN INVESTIGATION SYSTEM
There are some problems when conduct the investigation:
- Time
- Cost
- Science
- Politics
- Intervention


RECOMENDATION

A result from investigation is a recomendation which are the following:
- Does not take any action if the problem does not exist
- Perform system maintenance of the small problems
- Increasing the ability or skills
- Consider modifications to total system
- Putting the problem to occur in the development plan system which immediately made


INVESTIGATION TACTICS

Why we need tactics?
- to find all issues
- Knowing the causes of the emergence of problems
- to determine the appropriate solution
- Done so that all elements of the system can receive a solution without disrupting their activities.

Some of the tactics that can be done:
- Listen to opinions the subject of system
- Do not give the early breakthrough
- Compare the stories from the subject of system concerning in the same case
- Note the logical inconsistency problem


INVESTIGATION TECHNIQUE

Directly:
- The questionnaire
- FAQ
- Observations
Not directly:
- Flow of procedure
- Reviewing documents
- Sample
- Tabular


RECENTLY SYSTEM DESCRIPTION

- Input
- Output
- File
- Data elements
- Transaction volume and document action
- Data flow diagram


ANALYSIS REQUIREMENT
Stage of intensive interaction between the systems analyst with the end user where the system development team show their expertise to get feedback and trust so that the user get a good participation.

4 purpose that want to achieved:
- Explain the complete system
- describing the ideal Information System
- Bringing the ideal information system to a condition at this time to pay attention to the constraints of resources
- Providing encouragement to the confidence of user in the system development

Method:
- FAQ
- Kuisioner
- Observation
- Analysis procedure
- Document observation

Resources problems:
- Time
- Money
- Expertise
- Technology
- External Factors

Document requirement:
- Analysis direction: Relationships with end users, the observation process, problems in data collection
- User Requirements: actual requirement, reporting requirements, training requirement and the influence of the new system
- System Obstacle: Explaining the cost and time constraints, expertise, technology, and external factors
- Document form data collection instruments, statistical consensus, flow of the logical data and physical data, data elements in the initial data dictionary.


GENERATING SYSTEMS ALTERNATIVES

How to approach the condition of the system at this time with the condition of the ideal system?
- Create an alternative to solve the problem of information system
- The best alternative is applied wisely

Options Strategies
- Distributed versus centralized processing
Changes in information decision-making from the centralized data processing to the decentralized end user responsibility center
- Integrated versus dispersed database
System designer must consider the data which are entered in the database and into the file
- Surround Strategy of System Development
About important environmental strategy in the case of company takeovers because the information system of other companies may vary with the company at this time.

Options Tactics
- The design is done before the selection operation

Designing Operational Options
The design options can be grouped into:
a. Input
- Online Vs Off Line Data Entry
- Keyed Vs Machine Readable Data Entry
- Centralized Vs Decentralized Data Entry
b. Processing
- Batch Vs Realtime record update
- Sequential Vs Direct Access to records
- Single Vs Multiple Users update of records
c. Output
- Traditional Vs Turn Around Documents
- Structured Vs Inquiry-based reports


SELECTING THE PROPER SYSTEM

a. Comparing tactics: System comparison based on the costs and benefits relatively; There are 3 ways a system is superior to the other, if:
- A's cost is lower than B and both are the same benefits.
- A's cost is lower than B and A yield more advantage than B.
- A and B have the same but the A's cost advantage more than B.

b. Some methods of comparison system
- Break Even point Analyisis
- Payback Period
- Discounted PayBack period
- Internal Rate of Return

c. Category Cost
- Hardware
- Software
- People
- Suppliers
- Teleccommunications
- Physical sites

d. Fee Details
Comparing the cost of information systems through the life of the system, analysis is calculating the cost changes for the future and there are 3 models of cost of information system, namely Linear, and exponentially Step Function.

e. Cost of information system can occur only once and can also occur continously.
- The cost of information systems that occur only once is ontime cost and development cost that occur during the development of the system.
- The cost of information systems that occur on a continual basis are reccuring cost and operational cost where the cost of this is happened when the information system operates every day.


INFORMATION SYSTEM FACTORS
Qualitative factors that lead the performance of a good information system are:
- Reduce errors
- Reduce the time to fix errors
- Reducing the response time from the alternative workstation
- Accelerating the provision of information
- Increase the security system
- Have active update source record
- Increase user satisfaction


CORPORATE STRATEGY FACTORS
- Customer satisfaction
- Level sales increased
- Commitment of consumers and vendors
- Information of marketing products


PRESENTING LEARNING OF SYSTEM

- Conduct a brief presentation
- Reduce technical explanation in detail
- Presenting clearly with visual aids
- If using a model using a tool such as a laptop so that more informative
- Emphasize the benefits of the proposed information system with some alternative that is appropriate conditions experienced by the company.


CONTINUING THE DECISION OR NOT
- If the company decided to develop the system, the information department will do next, namely the System Design Process.
- If the other way then the System Development Life Cycle (SDLC) will be terminated.
- Often a problem will be found with the study system and then usually top management will ask for the re-employment the study system.
- Model will describe some of the stages of the repeated and sometimes the information will make a decision before the repeat stage system of study.
- With the alternative, the decision to repeat a previous stage SDLC or not is called Go-No-Go Decision.

Base Concept of Information.

Information can be defined as follows:

Information is processed data become more good form for and more meaning to accepting its source of information. Data represent plural form called datum. Data is fact depicting an events and unity of reality.


Quality of information depended from three things, these are information have to be accurate, punctual, and relevant.
Accurate : meaning the information have to free from mistake and express its intention.
Punctual : meaning the incoming information at receiver may not lose time.
Relevantly : meaning the information have benefit for its user.

Base Concept of System

There are two approach groups in defining system, that is emphasizing at its procedure and emphasizing at component or its element. Approach of more emphasizing at system of procedure define the following system:

System are network work from procedures which is interaction, gathering together to conduct an activity or to finish an certain target.


Approach of system representing network work from procedure more emphasizing of medley operate for in system.
Procedure defined by Richard F. Neuschel the following :

A procedure is medley operate for clerical, usually entangle some people in one or more departmental, applied to guarantee uniform handling of business.
transactions that happened.


While approach of more emphasizing at system of element or its component define the following system:

System is corps of elements which is have interaction to reach a specific-purpose.


A system have characteristic or nature of is certain, that is:

1. Components
Component which interact, work along to form one unity

2. Boundary
Limiting system with other system or with external environment

3. Environment
Everything beyond the bounds of the system cause influence operation system

4. Interface
Link between one sub system with other sub system

5. Input
Something entered into system can be the form of treatment input and signal input

6. Output
Result of from something processed and classified to become output which good for

7. Process
Change input become output

8. Objectives and Goal
System told to succeed if or when have hit target or its target


System can be classified from some viewpoint, among others shall be as follows:
1. System classified as abstraction system and physical system
2. System classified as natural system and system made in human being
3. System classified as certain system and indefinite system
4. System classified as closed system and open system


COMMON CONSDERATION OF SYSTEM APPROACH

The Importance of System Development

System development can mean to compile a new system to replace a whole old ones system or to improve or to repair the system. Mentioned matter can be caused of several things:
1. Existence of problems.
Problems can be arising from:
a. Unfinished problem.
That is:

  • intended deceivingly which can cause of danger to the properties and the truth of company data become less guaranteed.
  • mistake which do not be intended which also can cause the truth of data become less guaranteed.
  • inefficient of operation
  • do not adhere of policy of management which has been specified
b. Growth of Organization.
Growths of organization can cause of compile new system. The example is requirement of information which become progressively wide, data-processing volume become progressively mount, and change of new accountancy principle.

2. To reach for opportunity
Organizational start to feel that this information technology require to be ready to used to increase information so that can support in course of decision making to conducted by upstairs management.

3. Existence of Instruction
Compilation of new system earn also happened caused of instruction upstairs management level or from outside organization.

Besides things above there are also other indicator which cause system old ones have to change, among others:
  • Sigh of customer/ client.
  • Delivery of goods which often delay
  • Payment of salary which often lose time
  • Inopportune report
  • Report content which is wrong often
  • Indistinctness responsibility
  • Abundant in working
  • Low labor productivity
  • Lose time market interest
  • High operating expenses
  • Inefficient investment


The Purpose of Developing an Information System

After developing new system, expected improvement in new system. This improvement relate to PIECES, that is:
  • Performance, improvement of new system performance so that more efficient. Performance can be measured from throughput and response time. Throughput is the amount of work which can be done certain in a moment. Response Time is average time which delays among two work added with response time to answer the work.
  • Information, improvement of quality of presented information.
  • Economic, improvement of advantage or benefit.
  • Control, improvement of controlling for detecting and repairing some mistake and also insincerity.
  • Efficiency, improvement of operating efficiency.
  • Service, improvement of service given by system.


Principle of System Development.

1. The system is developed for management.
After the systems have been developed, furthermore which must be done to use this information system for management.
2. The system is developed for big capital investment.
The developed system represent big capital investment, hence which have to consider two matters on the following:
  • All existing alternative have to be investigated. All ekonom mention it with opportunity cost term. If there are some chosen investment that can be inculcated, hence the choice must be at highest investment of its advantage storey.
  • Good investment has to be valuable. The best chosen investment of course not represent most beneficial. Investment told to profit if its benefit or result of returning is bigger than expense to obtaining it.
3. Developed system needs one who is educated.
Educated of its intention non meaning graduated to college. But its intention earn has be done on the job training. Besides a system analyst have to education to problem of which is faced it.
4. Step work and duty must be done in course of system development.
Its intention is before system development process is done, hence have to be made beforehand job schedule that showing step work and duty to be done, so system development process can be done and finish successfully as according to planned budget and time.
5. Process system development doesn’t have to sequence.
The example, at the time of conducted hardware levying, meaningless the other process system development is discontinued just for waiting the hardware which it’s required, but can be done by other scheme which is not irrespective hardware existence.
6. Don't be afraid to cancel the project
At certain moments, where a project have to be discontinued or canceled because have improper again, hence must be done emphatically. Doubtfulness in running the project which have improper can cause permeating its of useless fund.
7. Documentation must be for guidance in system development.
Documentation is very important matter in development system. Often happened to some analyst system, documentation processing at the end of system development process, even worse they do not have documentation. Documentation which is made and collected during development system process can be used for communications between analyst system within user and can be used to push involvement of user.


System Development Life Cycle

1. WaterfallModel

Requirement
At this phase happened is gathering the requirement of system base. The examples are software, human being, and database. This phase also include, gathering of requirement at strategic business storey level and business area storey level.

Design
This Phase is process which focusing at four attributes: data structure, system architecture, interface representation, and algorithm. This phase is translate requirement process into software representation.

Implementation
Design have to be translated into machine language form. The making of code step reside in this phase. If the design completely done, making the code can be finished mechanically.

Verification
After made the program code, program examination is started. Examination process focus at internal logic software, examination to find mistake and ascertain input is limited that will give result of appropriate actual.

Maintenance
This Phase is system maintenance process. System possibly will experience of change after submitted to customer.


2. Iterative Model
It does not far different from waterfall model. Model iterative even also have phase at the time of planning, and analysis of design, implementation, and launching. But this model form is a cycle. There are conducive evaluation phase of system which make improve or repair, if still there are some mistakes, then return to planning phase to yield better system.


3. Spiral Model
Model Spiral initially proposed by Boehm [ BOEHM88]. Model spiral is software process model which is evolutional which stringing up the nature of iterative model and the systematic nature from the waterfall model. This model contain six duty region **:
Customer Communications: duty which is required to develop effective communications among customer and developer.
Planning: duty which is required to define resource, accuracy of time, and other related information.
Risk analysis: duty which is required to appraise good risk of management and also its technical.
Engineering: duty which is required to develop one or more representation the application.
Construction and launching: duty which is required for construction, testing, installing, and giving service to user.
Customer evaluate: duty which is required to obtain feed back from customer.
**Source: Pressman, Roger S., Ph. D., Software Engineering: A Practitioner’s Approach, Mcgraw-Hill, 1997, page. 47.


4. RAD (Rapid Application Development) Model
RAD is a growth process model of software which emphasizing very short growth cycle. Phase process RAD shall be as follows:

Business Modeling
What’s information controlling business process? Who’s peep out? Who’s processed? These questions is what kind of information which related to business.

Data Modeling
Information which have been modeled to be defined into data form. The data will be processed at next phase.

Process Modeling
Data which have been collected mentioned is hereinafter processed. This process include: adding, lessening, modifying.

Application Generation
Data which have been processed to be required at the time of making application. Application made with high level programming language so that yielded application can be used better.

Testing and Turnover
RAD process emphasize at usage return, therefore many examinee program component. Besides at this phase, the customer / client have to be trained by the way of using it.


Approach of System Development

There are some approach for the system development:
1. Classical approach against structured approach ( looked into used methodologies). Classical approach methodologies is developing system by following steps in system life cycle. This approach emphasize that system development will succeed if or when following step in system life cycle.
1.1 Classical approach
Classical approach also referred as traditional approach or conventional approach. This approach follows steps in system life cycle without supplied with adequate techniques and appliances. Problems can arise in classical approach are:
  • Software development become too difficult.
  • System maintenance cost become costly.
  • Possibility of happened mistake very big.
  • Efficacy of system less guaranteed.
  • Problem at applying the system.
1.2 Structured Approach
This approach must be the same with classical approach. The difference is the structure follows steps in system life cycle supplied with techniques and appliances which have is adequate.

2. Piecemeal approach against system approach (looked into the target to reach).
Piecemeal approach represent approach of system development emphasizing at just certain application or activity. This approach only paying attention target to application or activity.
System approach pay attention in information system as one unity to the each activity or its application. This approach also emphasize at overall goal achievement from organization.

3. Bottom-up approach against Top-down approach (looked into the way of determining requirement of system).
Bottom-up approach started from formulation of requirements to handle transactions and climb level by formulating requirement of information pursuant the transaction.
Top-down approach is distinct from under-up approach. This approach is started from defining target and policy of organization, analyze requirement of information, until transaction process.

4. Total-system approach against modular approach (looked into the way of developing it).
Total-system approach represent approach totally developing system at a time. Modular approach, approach by breaking complicated system become some simple part, so that system will be more easy to comprehended and developed.

5. Great loop approach against evolutionary approach (looked into technology to be used).
Great loop approach apply totally change at a time use sophisticated technology. This change contain risk, because technology untimely expand. This approach also too costly because needs very big investment at the time levying the technology. Evolutionary approach apply sophisticated technology just for applications which need at that moment. The advantage is investment do not too costly but still can keep abreast of technology.


Methodologies System Development


Methodologies
is unity of methods, procedures, work concepts, used postulates and rules of science, artistic or the other discipline.
Method is a way of systematic technique to do something. Methodologies system development mean is methods, procedures, work concepts, postulates and orders to be used to develop an information system. By following method or procedures given by an methodologies, hence system development expected will be able to be finished successfully. Procedure steps for this trouble-shooting is recognized with algorithm term.
Three classifications of development methodology:

1. Functional Decomposition methodologies.
This methodologies emphasize at resolving of system into smaller subsystems, so that will be more easy to be comprehended, to be designed and applied. Which included in this methodologies is:
  • HIPO (Hierarchy plus Input-Process-Output).
  • Stepwise refinement or Iterative stepwise refinement.
  • Information-Hiding

2. Data-oriented methodologies
This methodologies emphasize at characteristic of data to be processed. This methodologies is grouped into 2 class:
a. Data-flow oriented methodologies
This methodologies is in general relied on resolving of system into modules to from data element type and behavior of the module logic in system. Which included in this methodologies is:
  • SADT (Structured Analysis an Design Techniques)
  • Composite Design
  • Structured systems and analysis and Design (SSAD)
b. Data structure oriented methodologies
This methodologies emphasize structure of input and output in system. Which included in this methodologies is:
  • JSD (Jakson’s systems development)
  • W / O (Warnier / Orr)


3. Prescriptive Methodologies.
Which included in this methodologies is:
  • ISDOS (Information System Design and Optimization System). Usefulness of ISDOS is automatization process system development of information. ISDOS have two component, these are PSL and PSA. PSL represent especial component of ISDOS, that is a language to note requirement of user to machine-readable form. PSA represent software package which look like with data dictionary and used to check entered data, which is kept, analyzed and yielded as report output.
  • PLEXSYS. Its usefulness is to conduct a high level computer Ianguage transformation to an executable code to hardware configuration which wanted.
  • PRIDE, representing a software which good to analysis / designed by structure system, data management, project management and documentation.
  • SDM / 70, representing a software contain with method corps, estimation, documentation and guide of administration utilize to help user to develop and take care of effective system.
  • SPECTRUM, representing methodologies of system development and have some version. SPECTRUM-1 (for conventional life cycle), SPECTRUM-2 (for structured project management system) and SPECTRUM-3 (for on-line interactive estimator).


Technique in System Development

1. Project management technique is CPM ( Critical Path Method) and PERT (Program Evaluation and Review Technique).
This Technique is used for project scheduling.
2. Finding fact technique, that is technique able to be used to collect and find facts in study activity existing system. This techniques among others:
1. Interview
Advantages
a. Interview give opportunity to interviewer to motivate customer to answer freely.
b. Enabling interviewer to develop questions according to the situation that happened.
c. Interviewer can assess the truth of behavior of given answer.
Disadvantages
a. Interview process require so many time.
b. Tend to disturb the one who is held an interview.

2. Observation
Advantages
a. Collected data very accurate.
b. System analyst easier to process collected data.
c. Work storey level can be measured.
Disadvantages
a. Can bother observation object
b. Observation can bother work which is doing.

3. Questionnaire
Advantages
a. Questionnaire good to resource which is many and spread over.
b. Responder do not feel annoyed.
c. Relative more efficient.
d. its result more objective.
Disadvantages
a. Questionnaire do not guarantee responder to answer the question better.
b. Tend to inflexibility.
c. Complete questionnaire difficult to be made.

4. Gathering sample

3. Cost-effectiveness analysis technique
This technique emphasize that advantage of information system development not all can be measured directly with money value, like for example advantage of better service to the customer. But, if we like to determined with money value, hence can appraise its effectiveness.
4. Meeting technique
During conducted system development process, oftentimes meeting performed either by developer team with user and manager. Intention of meeting is to:
  • Defining problem
  • Collecting ideas
  • Solving problems
  • Finishing conflict that happened
  • Analyzing progress of project
  • Collecting fact or data
5. Inspection technique
Process from analysis and designed system have to observe. Observation of management represent matter which is very needed. Intention of inspection is to assure that documentation which have been made by developer team is competent and correct technique.


System analyst and programmer
Following is difference between system analyst and programmer:

Programmer
  1. Responsibility only limited to making of computer program.
  2. Programmer knowledge limited enough to computer technology, computer system, utilities, and programming Ianguage.
  3. Its work have technical and have to precisely in making instructions program.
  4. Its work do not concerning relation with many people, limited to each programmer and system analyst.

Analyst System
  1. System analyst responsibility do not only at making computer program, but at a whole system.
  2. Its knowledge have to wide, not only at computer technology, but also at the other application area.
  3. Its work in making of program limited to trouble-shooting marginally.
  4. Its work entangle many people relation, does not limited to each system analyst, programmer, but also with user and manager.


Knowledge and needed by system analyst

  1. Knowledge and membership about data-processing technique, computer technology and computer programming.
  2. Knowledge about business in general. This knowledge is required so that system analyst can communicate with user. This knowledge cover financial accounting, cost accounting, accounting management, management operation system, marketing, and other business aspects.
  3. Knowledge about quantitative method. In developing application models, system analyst using many quantitative methods, like for example linear programming, dynamic programming, and others.
  4. Expert of trouble-shooting. System analyst must have ability to put down complex problems into parts of small and then solving it.
  5. Expert of communications between personnel. System analyst must have ability of communications, either through oral and also article.
  6. Capable to construct relation between personnel. Constructing good relation between personnel can improve team performance. That thing represent responsibility from a system analyst.